Digital Games: How Sports Technology and Analytics Are Changing Sports

Home runs, touchdowns and points are all statistics that the average sports fans fully understands and can talk about regularly. But much of the time, this doesn’t tell the whole story. As teams look to gain an edge against competitors, they have begun to use advanced statistics and sports analytics to better understand performance. With the advent of incredible new technology, stats are not only easier to compute quickly but also easier to understand by coaches, players and fans alike.
The Emergence of Sports Analytics
For decades, professional sports have mostly evaluated players and performance via simple statistics and scouting. Often based on tradition, pro scouts learned from seasoned scouts and used the same evaluation techniques. The same can be said for statistics. While some stats changed over time, they remained relatively simple. This all changed with the arrival of Billy Beane.
Moneyball and the Birth of Sports Analytics
While Billy Beane certainly did not invent sports analytics, he was among the first to actively use analytics in a professional management setting. After serving as a scout and assistant general manager for the Oakland Athletics for eight years, Beane was named general manager of the A’s in 1998.
Beane was revolutionary for using sabermetrics — the empirical analysis of baseball — to find efficient players who Oakland could acquire at value. Rather than spend millions of dollars on a player Oakland couldn’t afford, Beane focused on players with strong on-base percentage. Beane’s actions and influence were immortalized in Moneyball, the best-selling book by Michael Lewis that followed the 2002 Athletics. With a fraction of the payroll of teams like the New York Yankees, the A’s won their division and made the playoffs.
The Sloan Conference
After the publication of Moneyball, the sports world and stats aficionados became fascinated with the prospect of advanced statistics and sports analytics. This resulted in the formation of a sports analytics community, with its largest event becoming the MIT Sloan Sports Analytics Conference.
The Sloan Conference was founded in 2006 by students from MIT’s Sloan School of Management. The students and well-known sports professionals who advise them have helped the Sloan Conference grow from a small event attended by 175 people in its first year to a massive convention featuring thousands of attendees.
Everyone who is anyone in sports analytics attends the event. The conference attracts professional sports teams from leagues across the globe and plays a significant role in the sports analytics movement. In 2012, Fast Company called the Sloan Conference the third most innovative company in sports.
No longer are advanced statistics relegated to online sports message boards and academic communities. Sports analytics are commonplace, used by sports writers, broadcasters and fans. With thought leaders in the media paving the way, fans have been able to grasp sports analytics fairly quickly. While there are plenty of fans still unaware of the full impact of the stats revolution, it will no doubt play a bigger role in the future.
How Leagues Use Analytics and Technology to Their Advantage
Sports analytics have allowed professional leagues to integrate the new wave of stats and technology differently. While the NFL has a product that may be less conducive to advanced statistics, the MLB and NBA have both opened their arms to the revolution. By providing large amounts of data to both their teams and the public, they are fostering the growth of sports analytics.
NBA and SportVU
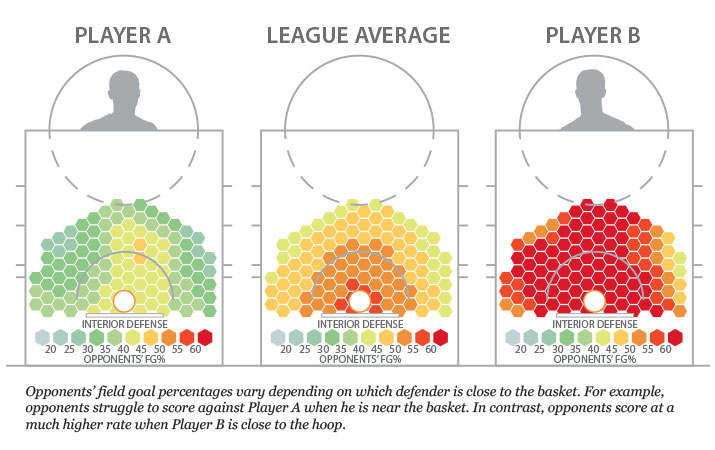
The NBA is at the forefront of the statistical revolution, mostly thanks to SportVU. This system of cameras hangs from the rafters in basketball arenas and collects data at a rate of 25 times per second, following each player and the ball on the court. This measures everything from how far each player has traveled during a game to how many opportunities at a rebound they had.
Four NBA teams began using the system at the start of the 2010-11 season. After the successful test, the league spread the system to all 30 teams at the start of the 2013-14 season. Now, every single game is cataloged using the system and is integrated for use in television broadcasts.
But the biggest innovation has been the ability to make this data widely available to the general public. All of the statistical data the SportVU cameras capture is available freely to the public on the NBA’s stats website. This has made the work of amateur and professional statisticians far easier and is causing untold growth in basketball statistics.
MLB and Statcast
Professional baseball joined in the player tracking business with the unveiling of Statcast in 2015. This system combines cameras and radar technology to measure everything that’s happening on a baseball field. It spits out statistics on pitching, batting, base running and even fielding. The statistics are all based on distance, position and speed, but also can help break down what happens during a baseball play.
Like the NBA, the MLB is making Statcast available to the general public for free. This is helping fans quantify the performance of their favorite teams and players beyond the traditional statistics. The system is also a big part of many baseball broadcasts, with experts analyzing each play.
Most important, Statcast provides defensive statistics on players. This has always been the area of baseball for which statistics have been unable to quantify performance fully. The MLB hopes that the availability of defensive information will lead stats enthusiasts to develop a better way of measuring defense.
Effects of Sports Technology and Analytics
The melding of sports technology and analytics has only begun to have a wider impact on the entire sports industry. Years from now, the effects will likely be far greater and different than what we expect now. The following are three game-changing impacts.
Public Consumption
Technology has made it easier for statistics to be shared. The sports analytics community is incredibly present on the Internet, with countless websites dedicated to the discussion and interpretation of advanced statistics. While most of this helps the fans get involved with sports on a deeper level, like intensifying fantasy sports competition between them, it has also helped teams educate fans on what happens in front offices. In essence, they are better fans and better lovers of the sport.
Convenience
Sports leagues and teams are using technology to measure sports analytics more conveniently. Technology like the SportVU camera system used in every NBA arena is allowing teams to gather data and synthesize it faster than ever before. Teams use this information and give it to fans on a scale that would have been impossible just a decade ago.
Improved Decision-making
The most important effect is the revolution in decision-making for teams. All teams have an analytics director or staff, compiling the advanced statistics to help the team. While each team likely uses its own combination of statistics, these complex measurements are being used to improve teams more and more. And by all accounts, sports analytics are making players and teams better. With the breadth of information, front offices can make better decisions and teams can win more games.
The Future of Sports Technology and Analytics
It’s imperative that those interested in a career in the sports industry understand the growing role of sports technology and analytics. At Concordia University Texas, students in our online sports administration graduate programs learn about all of the emerging trends affecting the industry. With real-world knowledge provided by experienced professors, you can gain the skills you need to turn your passion for sports into a successful career. Learn more about our Master of Education in Sports Administration today.

